Cyclic Voltammetry of Ferricyanide Using Carbon Screen-Printed Electrodes – Randles–Sevcik Analysis
|
|
Time to read 2 min
|
|
Time to read 2 min
Cyclic voltammetry is a fundamental electrochemical technique used for characterizing redox systems. It involves sweeping the potential of a working electrode and monitoring the resulting current to explore redox behavior. In this study, we use the reversible Fe(III)/Fe(II) redox couple - ferricyanide/ferrocyanide to demonstrate the capabilities of CV using carbon screen-printed electrodes (SPEs).Unlike conventional three-electrode systems (e.g., glassy carbon, Ag/AgCl, Pt), SPEs are compact, disposable, and cost-effective. They integrate all three electrodes onto a single substrate, making them ideal for teaching and laboratory testing.
We will also evaluate the system using the Randles–Sevcik equation, which relates peakcurrent to scan rate and diffusion coefficients, confirming whether the reaction is diffusioncontrolled.
For a reversible redox couple at room temperature (25°C), the Randles–Sevcik equation is:
![]()
Where:
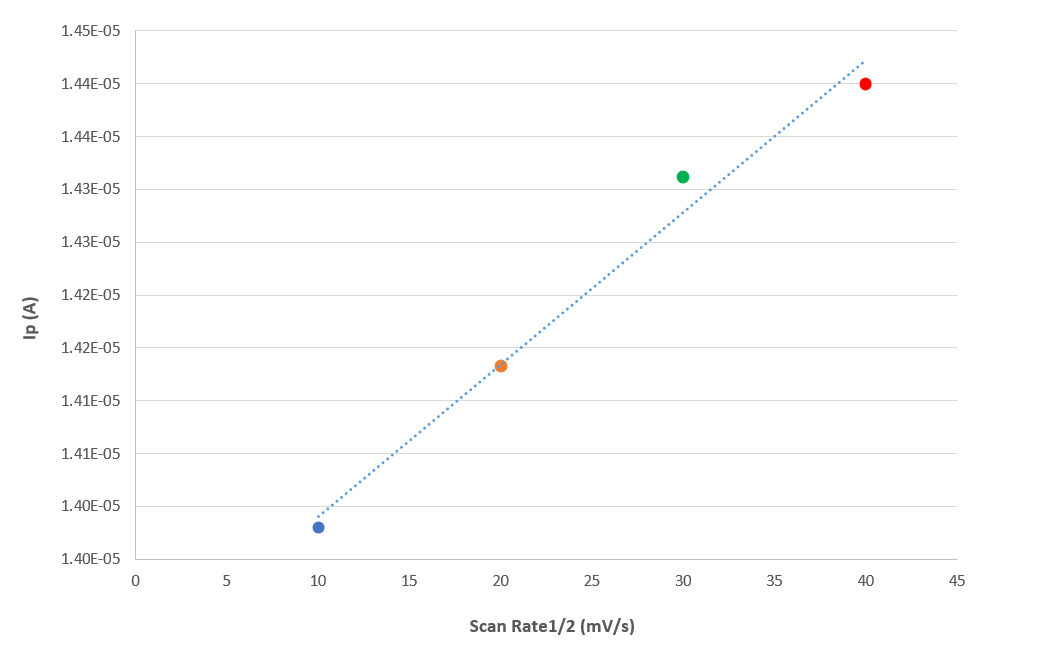
A linear relationship between the peak current ip and the square root of the scan rate (v1/2).

Figure 3: CV Plot
After the CV is completed:
To test the Randles- Sevick relationship:
Increasing scan rate result in:
At higher scan rates the rate of diffusion is more than the rate of reaction. Hence, more electrolytic ions reach the electrode electrolyte interface whereas very few ions participate in the charge transfer reaction. Therefore, the current at higher scan rate increase. Therefore, peak height increases with increase in scan rate. This is also evidenced by the increased voltage difference between anodic and cathodic peaks at higher scan rates
If the graph is linear the system behaviour agrees with Randles-Sevcik theory. From the slope, we can also estimate D (diffusion coefficient) if other parameters (A, n, C) are known.
This experiment successfully demonstrates cyclic voltammetry using carbon screen-printed electrodes with ferricyanide. This validates the use of SPEs in electroanalytical studies and highlights their potential for low cost analysis.


